For media companies running many channels
Review your YouTube portfolio in one research workflow
Compare uploads across the channels you run and the rivals you follow. OutlierKit gives your team a common starting point for its next portfolio review.
30 minutes with the founder · Or start a free trial, no credit card
Try it yourself with 30 free credits




Score these three media channels side by side: Complex, Tasty and Tastemade. Which one is holding its normal?
Each channel's last five uploads against its all-time average:
- 1.Complex84%Subscribers: 7.0M · All-time avg: 463K · Last 5 avg: 386K
- 2.Tasty3%Subscribers: 21.2M · All-time avg: 945K · Last 5 avg: 28K
- 3.Tastemade2%Subscribers: 1.9M · All-time avg: 64K · Last 5 avg: 1.1K
Highlighted figure: last 5 vs avg.
Complex is holding its normal. Its recent uploads average 84% of its all-time average. Tasty's and Tastemade's sit at 2 to 3% of theirs.
Media-company channels, broken down
Full breakdowns of channels run by media companies rather than individual creators, with the format mix and reach ratio a portfolio can be measured against:
 Tastemade
Food & travel
- Subscribers
- 1.9M
- Avg views
- 64.2K
 Tasty
TastyFood & recipes
- Subscribers
- 21.3M
- Avg views
- 938.7K
 Complex
Culture & entertainment
- Subscribers
- 7.0M
- Avg views
- 460.0K
Est. $10K to $31K/mo
Read the analysis → WatchMojo
Top 10 lists (faceless)
- Subscribers
- 25.8M
- Avg views
- 540.0K
Est. $7K to $24K/mo
Read the analysis →Figures reflect the saved channel snapshots. Open an analysis to review the full context.
How it works
See which channels deserve a closer review
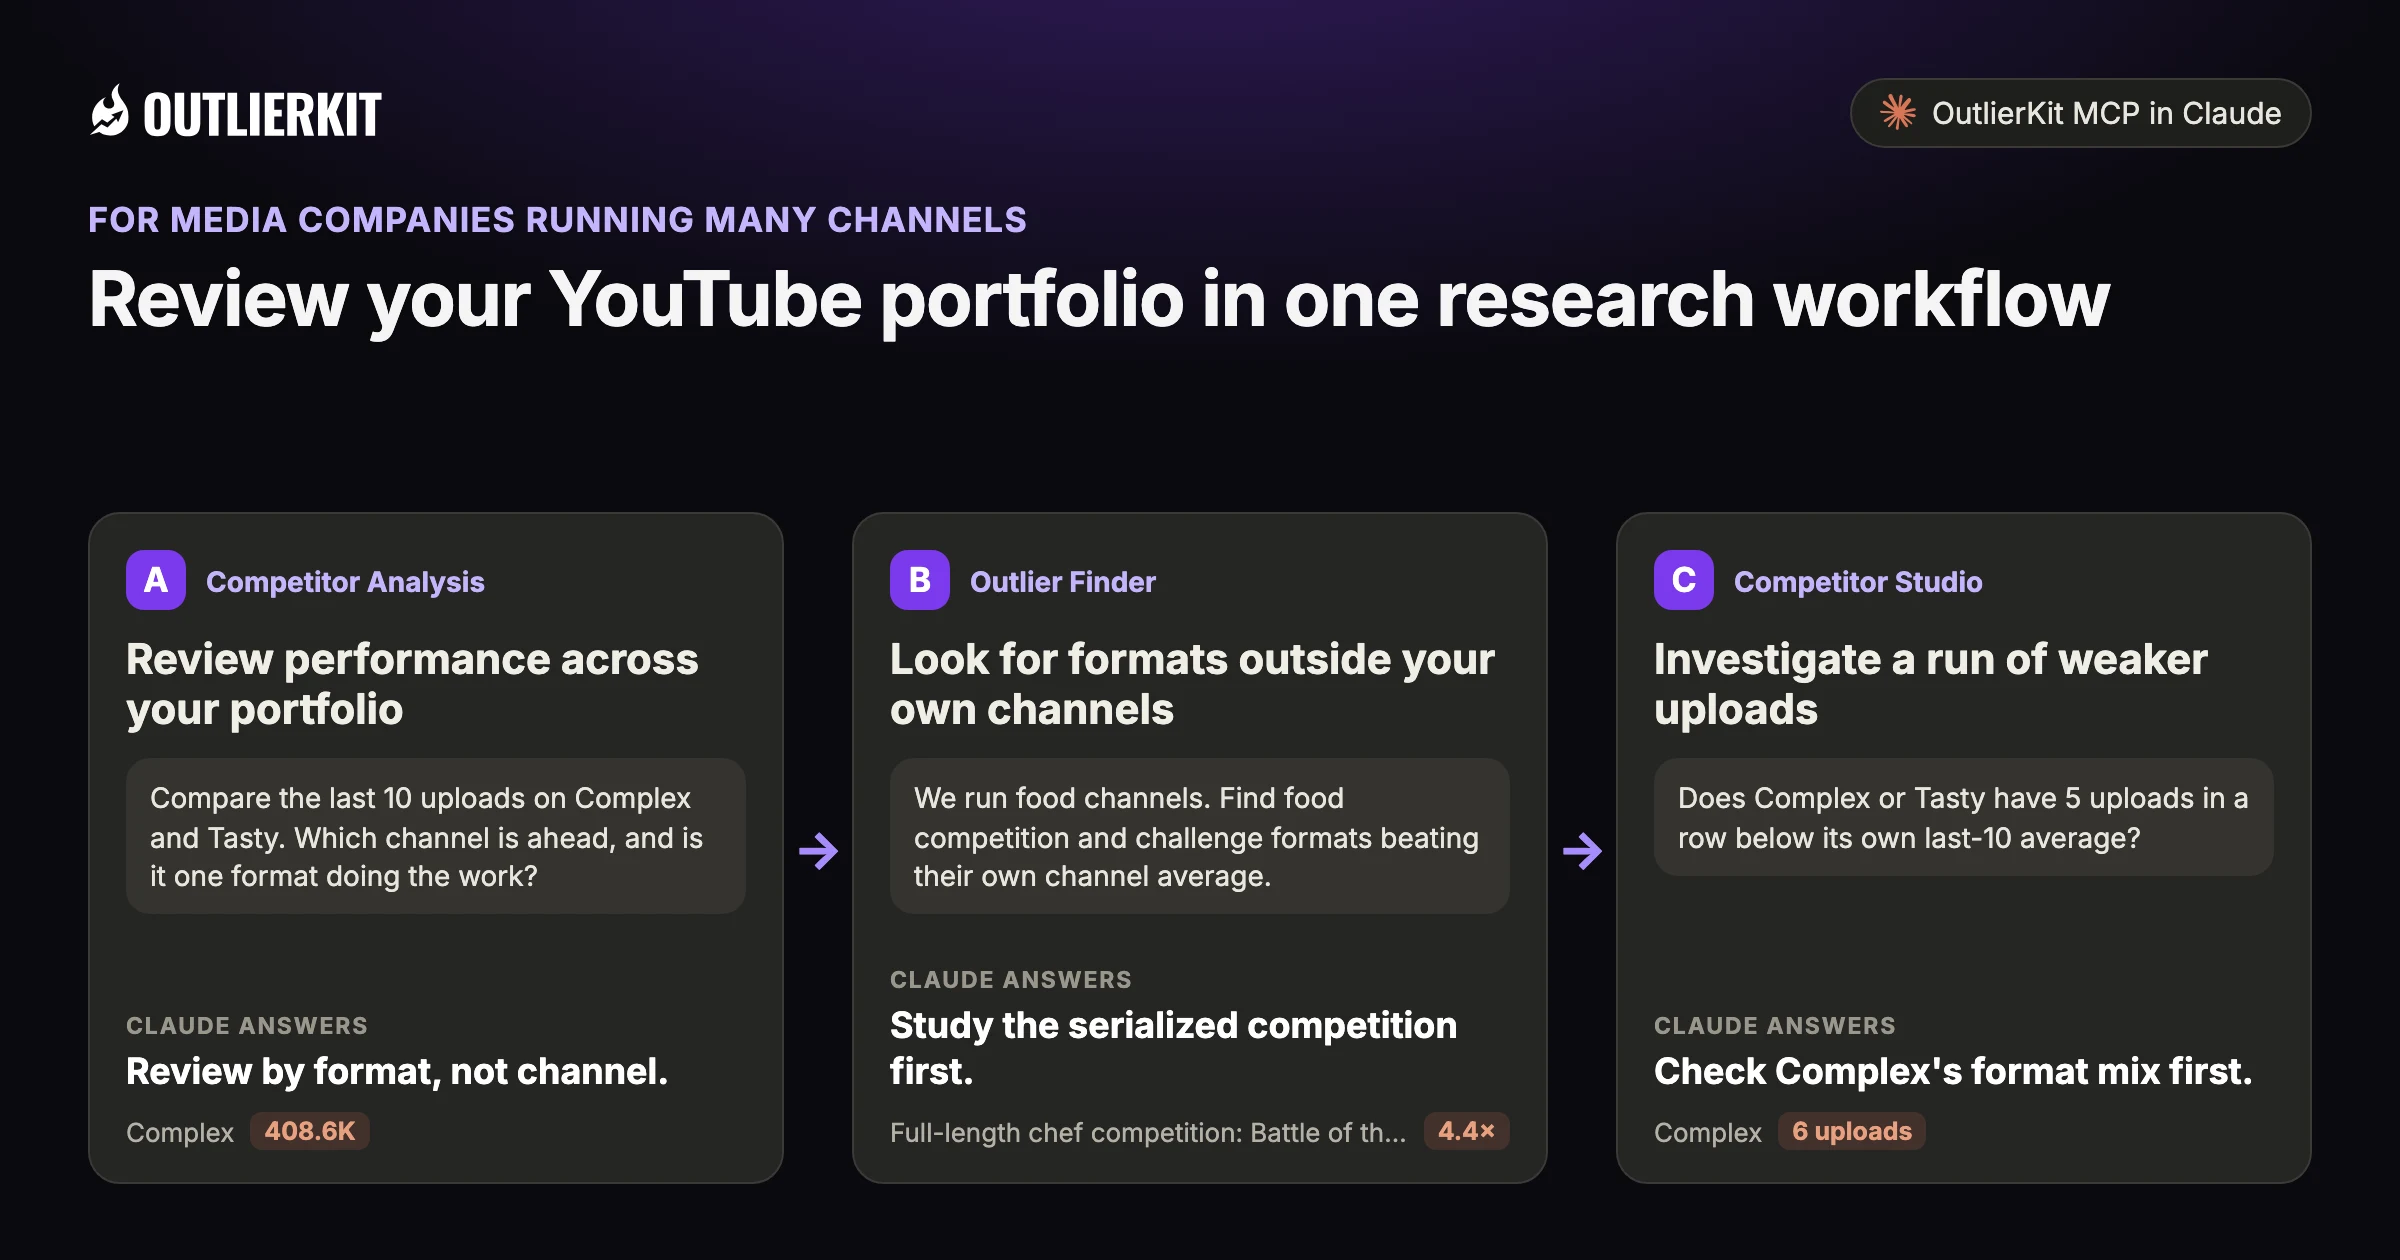
- Review performance across your portfolioReview by format, not channel.
- Look for formats outside your own channelsStudy the serialized competition first.
- Investigate a run of weaker uploadsCheck Complex's format mix first.
Step 1 · Competitor Analysis
Review performance across your portfolio
Compare recent uploads with each channel’s history. Check video age and format before interpreting a gap as a decline.
- Claude calls
- channels_videos
- In this example
- Review by format, not channel.
Compare the last 10 uploads on Complex and Tasty. Which channel is ahead, and is it one format doing the work?
Complex averages five times Tasty's views per upload, but two videos carry most of it:
- 1.Complex408.6K7.0M subscribers · last 10 uploads range from 15K to 2.0M views · 6 days to 4 weeks old
- 2.Tasty81.2K21.2M subscribers · last 10 uploads range from 31K to 184K views · 16 hours to 1 month old
- 3.Sneaker Shopping carries ComplexTwo episodes, Ryan Reynolds at 2.0M views and Nina Drama at 895K views, hold 71% of Complex's views across the 10 uploads.
- 4.The typical upload is closerMedian upload: Complex 93.5K views, Tasty 53.5K views. Three Complex Style Podcast episodes sit at 15K, 23K and 47K views.
Highlighted figure: average views, last 10 uploads.
Review by format, not channel. Complex leads on average, 408.6K to 81.2K. On the median the gap is 93.5K to 53.5K. Tasty's four newest uploads are 10 days old or less.
Step 2 · Outlier Finder
Look for formats outside your own channels
Search related niches for outlier videos. Bring useful examples to the team responsible for the next production slate.
- Claude calls
- outliers_search
- In this example
- Study the serialized competition first.
We run food channels. Find food competition and challenge formats beating their own channel average.
Three food formats beat their channel average, from full competition episodes to a blind ranking:
- 1.Full-length chef competition: Battle of the Chefs, Season 3, Episode 264.4×ПЯТНИЦА · 66.3K subscribers · 489K views · 1 hour 42 minutes · Russian-language TV channel
- 2.Long challenge video: Funny Food Challenge3.6×Tiffydolly · 279K subscribers · 581K views · 31 minutes
- 3.Blind ranking: Chef Blind Ranks 5 Chefs3.5×Food Unfiltered · 18K subscribers · 56K views
Highlighted figure: vs channel average.
Study the serialized competition first. Three Battle of the Chefs episodes scored 2.3× to 4.4× on a 66.3K-subscriber channel. Use them as references for a slate discussion, not a view forecast.
Step 3 · Competitor Studio
Investigate a run of weaker uploads
Find channels with several uploads below their baseline. Use your private YouTube analytics to check retention and traffic sources.
- Claude calls
- channels_videos
- In this example
- Check Complex's format mix first.
Does Complex or Tasty have 5 uploads in a row below its own last-10 average?
Complex does. Its six newest uploads all sit below its last-10 average:
- 1.Complex6 uploadsThe six newest uploads drew 15K to 272K views against a 408.6K average. 7 of the last 10 are below it.
- 2.Tasty4 uploadsThe four newest uploads drew 31K to 58K views against an 81.2K average. They are 16 hours to 10 days old.
- 3.Complex without two Sneaker Shopping episodes3 uploadsThe other eight uploads average 148.9K views. Against that baseline the run stops at the 272K Kai Cenat interview.
Highlighted figure: longest run below average.
Check Complex's format mix first. Its run of six comes from an average set by a 2.0M and an 895K video. Confirm retention and traffic sources in YouTube Studio before calling a decline.
Before you record: packaging and script tools
Once you pick the idea, OutlierKit writes the packaging and checks your script. You still film and edit the video yourself. The Title tool ranks its titles against real breakout videos near your topic. All four are on every plan and the 30-credit trial. On Pro and Max, the MCP connector also lets Claude run OutlierKit research for you.
Title
Writes 16 titles and ranks them against real breakout videos near your topic, with a score and a one-line reason for each.
Open in the app →How it worksDescription & hashtags
Writes the 150 characters people see and the rest of the description separately, then picks your hashtags.
Open in the app →How it worksChapters
Writes chapter titles that help viewers scan the video and jump to the part they came for.
Open in the app →Script review
Scores the script you wrote and shows what to fix before you record, so you reshoot and re-edit less.
Open in the app →How it works
A worked example
Three media channels had very different recent-view baselines
On 11 September 2026, Complex's last five uploads averaged 386K views, 84% of its all-time average. Tasty's averaged 28K against a 945K normal. Tastemade's averaged 1.1K against 64K.
Subscriber counts hide this. Tasty has three times Complex's subscribers and a fraction of its current reach.
The example shows a dated research result in Claude. Use the prompts below to explore your own topic.
Try a research question →Score these three media channels side by side: Complex, Tasty and Tastemade. Which one is holding its normal?
channels_getchannels_getchannels_getEach channel's last five uploads against its all-time average:
| Channel | Subscribers | All-time avg | Last 5 avg | Last 5 vs avg |
|---|---|---|---|---|
| Complex | 7.0M | 463K | 386K | 84% |
| Tasty | 21.2M | 945K | 28K | 3% |
| Tastemade | 1.9M | 64K | 1.1K | 2% |
Complex is holding its normal. Its recent uploads average 84% of its all-time average. Tasty's and Tastemade's sit at 2 to 3% of theirs.
See the research tools in action
Watch the product walkthrough for a tour of channel research and Competitor Studio. The feature sections above show how those tools fit your work.

“Great addition to my stack and simple to use. Hit an issue and the team worked hard to fix it. Great product, hardworking team.”
“Been creating for years, running multiple YouTube channels. OutlierKit is the first tool that actually improved our view counts almost instantly. The competition analysis revealed gaps we never knew existed.”
“I use Outlier Kit for supplemental channel audits and to help clients brainstorm video ideas and/or explore pivot strategies. It's a fantastic competitive intelligence tool to have in your arsenal.”
“I was consistent with uploading videos, but at a certain point, I wasn't able to understand how things were working. With OutlierKit, I was really able to understand the competitor landscape and identify the kinds of opportunities I could bet on.”
“It's really simple and gives really useful data and insights for choosing WHAT to make and how to structure it better. Will recommend to anyone seriously committing to YouTube.”
“After implementing the recommendations from the first report last week, my latest video has nearly tripled in views (2000) compared to my previous best one (700), so the recommendations do work.”
One creator on a small channel. Not a typical or promised result.
More reviews people have posted on Product Hunt, X and LinkedIn, unedited.
Choose where to do the research
Use OutlierKit for public research. Your own YouTube analytics supply the private performance data. Claude is an optional way to query OutlierKit.
| Task | OutlierKit app | OutlierKit in Claude | YouTube Studio |
|---|---|---|---|
| Research other channels | Outlier searches and channel analysis. Pro and Max add niche-wide Competitor Studio. | Request channel data and outlier results with the OutlierKit connector. | Use your channel analytics to understand your own audience and uploads. |
| Read video context | Review video analysis and research results in the app. | Request public transcripts and comments, then ask follow-up questions. | Check your own retention and traffic sources to assess a published video. |
| Package the video | Title, Description & hashtags, Chapters and Script review. Titles are ranked against breakout videos near your topic. | Ask Claude to draft packaging from the research data. The ranked Title tool and Script review run in the app. | Edit the title, description, tags and chapters after upload. No comparison with other channels. |
| Choose a plan | Hobby starts at $49/month. Competitor Studio requires Pro or Max. | Included with Pro, Max and the active free trial. Calls use your OutlierKit credits. | Included with your YouTube channel. |
Read the connector guide or YouTube’s analytics guide for the available reports.
Choose a research plan
Max includes 2,000 monthly credits and 50+ channel connections. On-demand data updates support repeated portfolio reviews.
Hobby
Best for experts and coaches running one channel
billed monthly
- ✓100 credits per month
- ✓Outlier Research
- ✓Keyword Research
- ✓Single-channel analysis
- ✓Single-video idea research
- Competitor Studionot included
- MCP & API accessnot included
Pro
Best for experts, consultants and brands publishing every week
billed monthly
- ✓500 credits per month
- ✓Everything in Hobby
- ✓Deep Research
- ✓AI script and hook analysis
- ✓Competitor Studio: niche-wide intel
- ✓MCP & API access
- ✓50 credits per connected channel
Max
Best for agencies running client channels, API pipelines
billed monthly
- ✓2,000 credits per month
- ✓Everything in Pro
- ✓50+ channel connections
- ✓Niche-wide sponsor & comment intelligence
- ✓On-demand data updates
- ✓Priority API access
Start with a research question
Run three single-channel analyses for 30 credits. A Competitor Studio run costs 50 credits. Connect the MCP connector for 20 more, and the trial covers one run.
No credit card required. Competitor Studio needs a paid Pro or Max plan and 50 credits per run. You choose whether to upgrade.
Start free trial →A note from Aditi
A portfolio review should lead to a useful question for the production team. Public comparisons need the context in your own analytics.
I built OutlierKit to make this research easier to use. If you don’t find an insight worth pursuing during your trial, email me at hello@outlierkit.com. I’ll walk you through your YouTube strategy. If I still can’t help you find something useful, you get a full refund.
 Aditi, founder of OutlierKit
Updated
Optional: research inside Claude
Ask a follow-up question about the data
The OutlierKit connector lets Claude request research and shape it into a brief. Pro, Max and active trials include access. A prompt may require several paid tool calls.
Our channels are [list]. For each, compare the last 10 uploads with the channel's average. Rank them.
- You get
- A portfolio scorecard
- Tools called
- channels_get, channels_videos
- Cost
- 2 to 10 credits per tool call
Find formats beating averages in [niche] that none of our channels use.
- You get
- New formats to test
- Tools called
- outliers_search
- Cost
- 2 to 10 credits per tool call
Which of our channels has 5 uploads in a row below its average?
- You get
- Channels to fix
- Tools called
- channels_videos
- Cost
- 2 to 10 credits per tool call
Connect OutlierKit to Claude. For custom workflows, explore the API.
Free sample report
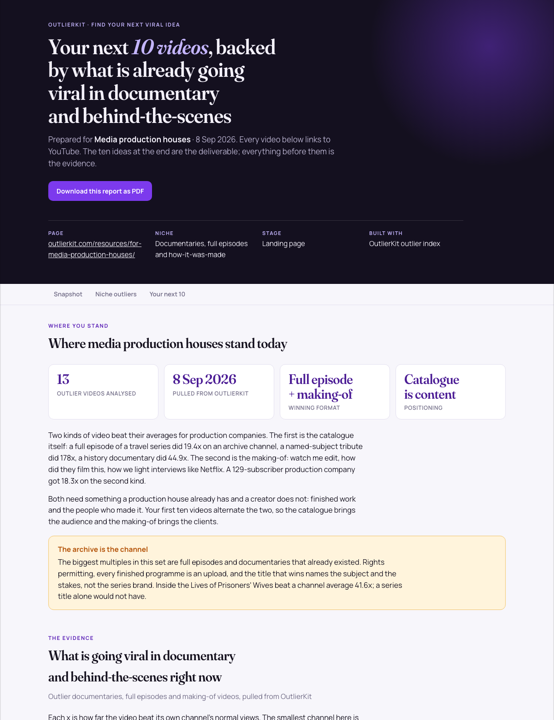
Video ideas for media production houses
Read the dated research and the source videos behind each idea. The report is available online or as a PDF, with no signup.
 Preview, opens the full report
Before you get started
Can it track channels we don't own?
Yes. You can research public channels you do not own. The detail available varies by channel.
Why compare recent uploads with the all-time average?
The lifetime average gives historical context. Recent videos have had less time to collect views, so compare similar upload ages and formats before calling a decline.
What is YouTube intelligence for media production houses?
It means comparing every channel you run, and your rivals, on the same scale. OutlierKit measures each channel against its own normal.
Which paid plans include the tools on this page?
Hobby starts at $49 a month with 100 credits. Pro is $99 with 500 credits and adds Competitor Studio, MCP and API access. Max is $399 with 2,000 credits and adds niche-wide sponsor research and on-demand updates. Annual billing is available.
Do I need Claude to use OutlierKit?
No. You can research in the OutlierKit app. The optional MCP connector lets Claude request public channel data, outliers, transcripts and comments. It is included with Pro, Max and an active free trial. Niche mapping and sponsor intelligence stay in Competitor Studio in the app.
What can I try before choosing a plan?
The free trial includes 30 credits with no credit card. Outlier and keyword searches cost 2 credits each; single-channel analysis costs 10. Competitor Studio costs 50 credits per run. Connecting the MCP connector adds 20 credits, so a trial can cover one run. On paid plans it is on Pro and Max. The Title tool costs 2 credits per run. Description & hashtags, Chapters and Script review are also included in the trial.
Can I change or cancel my plan?
Yes. Use your account settings to change or cancel your plan. The change takes effect at the end of the current billing cycle. Email hello@outlierkit.com if you need help.
Bring your channel portfolio to the demo
30 minutes with the founder · Or start a free trial, no credit card
Book a demo →