How Brands Use YouTube Research to Find a Lane They Can Own
A brand's hardest YouTube question is "what can we own?". The answer is a lane competitors have not already taken, and research finds it before production starts.
Businesses and brands are the largest user group on OutlierKit, and they use research to find a position. No other group leans on Trends and Niche research the way brand teams do. Copying what competitors post gives the audience no reason to switch, so treat YouTube like market entry: find the space where demand exists and no one has planted a flag. The payoff shows in reach. An average upload on Cleo Abram's channel reaches 60% of her 8.3M subscribers. In our reach ratio benchmarks for 7 niches, the niche medians run from 18% to 73%.
What does the brand usage data show?
Business and brand teams use three OutlierKit features far more than any other group:
57%
use Outliers to map what the category rewards
44%
check Trends before committing budget
37%
run Niche research to find whitespace
OutlierKit usage data, July 2026. Share of business and brand accounts using each feature.
How do brands find a lane on YouTube?
Map what is winning with Outliers
Start with outlier research across your whole category, including channels that do not compete with you. An outlier is a video that far outperformed its channel's normal reach, which makes it a clean signal of what the audience actually rewards, separated from channel size and ad spend. The outlier map answers three questions: which formats in the category are overperforming right now, which topics get strong engagement even from small channels (meaning the demand is topic-driven, not brand-driven), and what the audience rewards that no big player currently does well. That last list is the raw material for positioning.
Outlier Finder in action. Click to explore the tool.
Tool for this step: Outlier Finder →
Follow the attention with Trends
For a brand, timing carries budget consequences. Committing a quarter of production to a topic that peaked last quarter is an expensive mistake that a five-minute check prevents. Sort candidate topics into three bins. Rising: attention is moving in, and these justify real production investment. Steady: evergreen demand, the channel's reliable base layer. Falling: attention is leaving, so cut these even if a competitor just had a hit there.
Trending in action. Click to explore the tool.
Tool for this step: Trending →
Find the whitespace with Niche research
This is the step most groups skip and brands use most. The question it answers is the positioning question itself: where in this category is there real demand and weak supply? Whitespace shows up as a sub-topic with strong search and outlier activity but no dedicated channel serving it, an audience segment the big channels talk past (like practitioners versus beginners), or a format gap, like a category full of talking heads and no one doing teardowns or field tests. A brand that plants a flag in real whitespace gets the category association: when people think of that sub-topic, they think of you.
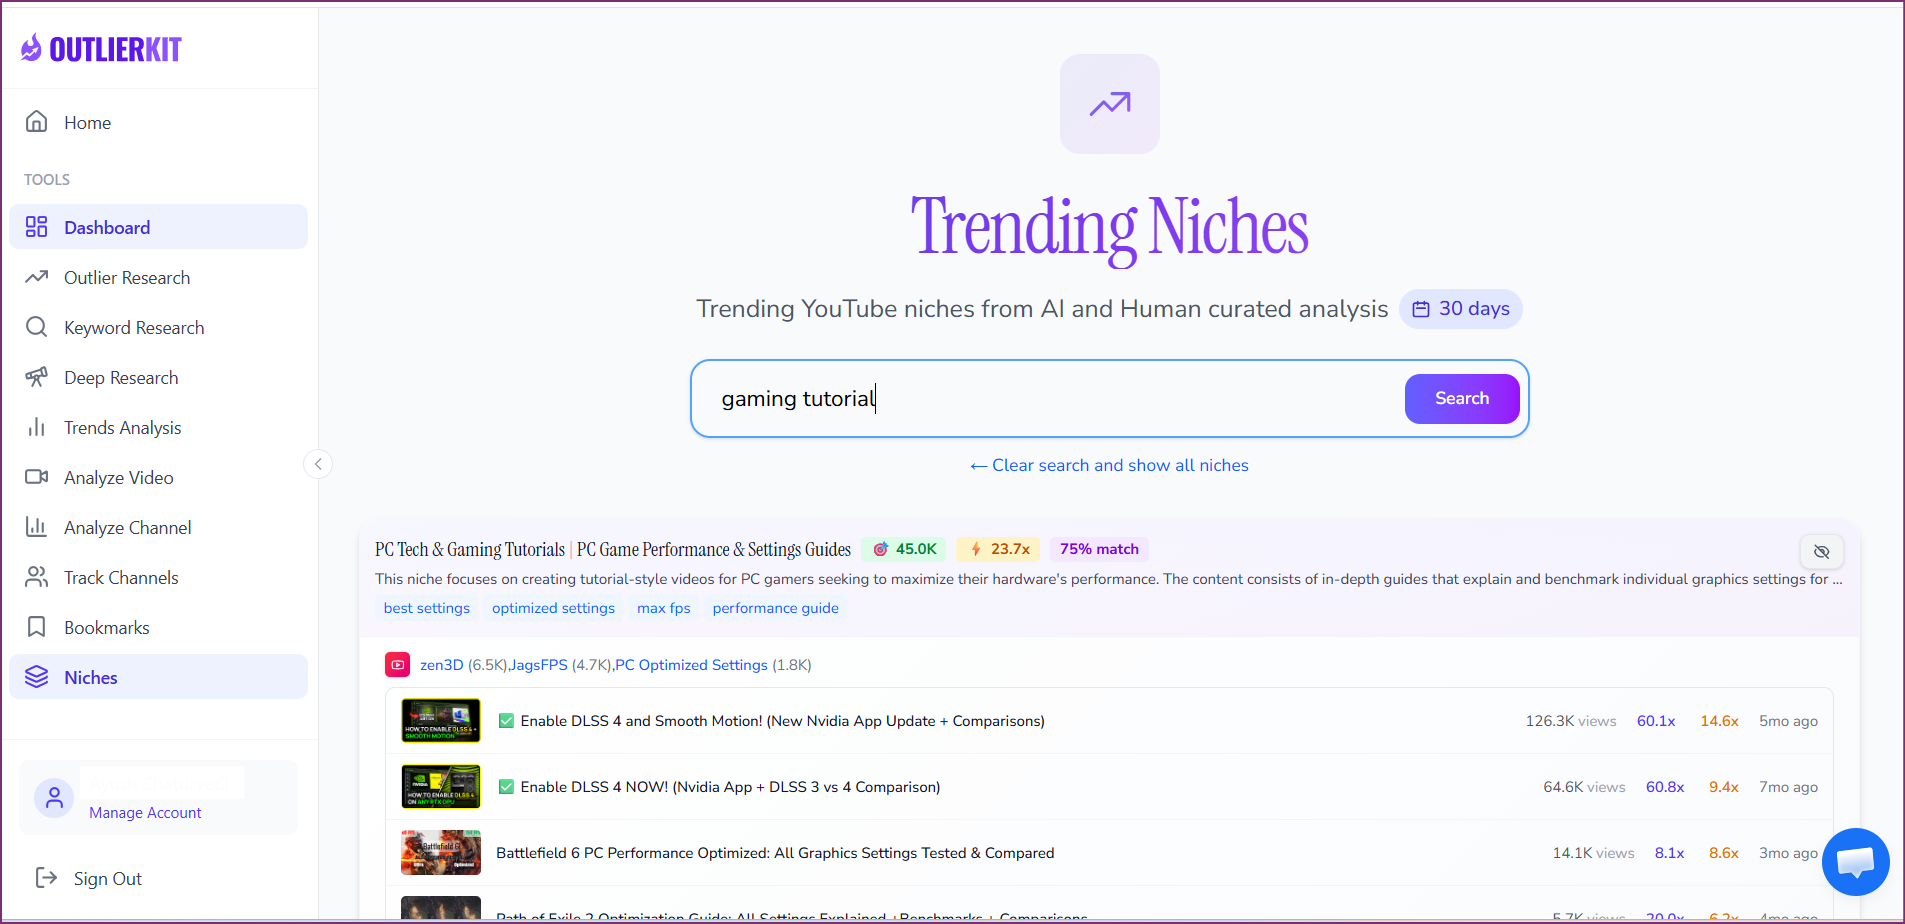
Niche Research in action. Click to explore the tool.
Tool for this step: Niche Research →
OutlierKit is built for experts, consultants and coaches who use YouTube to share what they know, whether they run the channel or an agency runs it. Brand teams run the same three steps. Once the lane is clear, its packaging and script tools help before you record: 16 titles ranked against real breakout videos near your topic, the description and hashtags, chapter titles, and a review of the script you wrote. They come with every plan and the free trial. On Pro and Max, the MCP connector at outlierkit.com/mcp lets Claude run outlier search, similar channels, channel and video data, transcripts, comments and keyword research, with Google sign-in and no API key.
What does the workflow surface for a real category?
Say you are a project-management software brand. The workflow might surface this:
- Outliers show "how I run my week" workflow videos overperforming across productivity channels, including small ones, so the demand is format-driven.
- Trends show interest in AI-assisted workflows rising, while generic productivity tips are flat to falling.
- Niche research shows nobody owns "workflow teardowns for real teams", because the big channels make solo-productivity content only.
The position follows: the channel that shows real teams' workflows, rebuilt. Every video strengthens the same association, which a me-too channel never builds.
What does owning a lane look like?
Two channels that named a lane, planted a flag, and now own the category association. Figures from their live OutlierKit channel analyses:
Owns “optimistic tech explainers”. 583 videos, 2.9B total views. Est. revenue $96K to $533K per month.
8.3M
subscribers
5.0M
avg views / video
60%
of subs reached per video
Owns “economics video essays”. 438 videos, 366.6M total views. Est. revenue $16K to $91K per month.
2.9M
subscribers
837K
avg views / video
29%
of subs reached per video
An average upload on these channels reaches 29 to 60 percent of their subscriber base. Compare that with big channels competing in contested lanes, where 2 to 6 percent per video is common: John Hammond averages 2.3 percent and Iman Gadzhi 6.3 percent on the same measure. The difference is the lane. When the audience associates a sub-topic with one channel, every upload starts with pull instead of a cold auction. That is the return on the whitespace step, and it is measurable before you commit a production budget.
Frequently Asked Questions
How long does it take for a brand to own a lane on YouTube?
Longer than a viral hit, shorter than most teams fear. Consistent output in a genuine whitespace usually shows category association within two to three quarters. You can see it in branded search lift and in suggested-video placement next to the sub-topic. The key input is consistency in one lane, not volume across many.
What if the whitespace we find is small?
Small and owned beats large and contested. A sub-topic with modest search volume where you are the default answer compounds over time. You can expand from an owned lane into adjacent ones. You cannot expand from an ignored one. Most failed brand channels picked the biggest lane in the category and became invisible in it.
Should the brand channel mention our product?
Sparingly, and in context. The lane earns the audience. Product placement inside genuinely useful content converts better than product-first videos that never build an audience at all. A practical ratio many brand teams land on: the product appears as the tool used in the content, not as the subject of it.
What metrics matter for a brand channel?
Three. Category search share: whether you are becoming the answer for your chosen sub-topic. Outlier rate versus the category: the share of your videos beating category norms, not just your own average. And branded search lift: people searching your name plus the topic is the clearest sign the position is taking hold.
Which channels show an owned lane in the data?
Live, data-backed analyses of channels that built owned lanes, from B2B to explainer formats:
Real channel breakdowns
See these strategies in the wild: full data-backed analyses of channels in this niche, including outlier videos, upload cadence, and growth patterns.
OutlierKit Channel Analysis

John Hammond
Cybersecurity
- Subscribers
- 2.1M
- Avg views
- 48.1K
- Total views
- 88.7M
OutlierKit Channel Analysis

TBPN
Tech-business live show
- Subscribers
- 126.0K
- Avg views
- 15.2K
- Total views
- 34.3M
OutlierKit Channel Analysis

Cleo Abram
Optimistic tech explainers
- Subscribers
- 8.3M
- Avg views
- 5.0M
- Total views
- 2.9B
OutlierKit Channel Analysis

Economics Explained
Economics (faceless)
- Subscribers
- 2.9M
- Avg views
- 837.1K
- Total views
- 366.6M
Stats are from our most recent snapshot of each channel. For live numbers, outlier videos, and up-to-date revenue estimates, run a fresh analysis on OutlierKit →
Sources and method
The feature shares come from aggregate OutlierKit usage data for July 2026: the share of business and brand accounts that used each feature. No individual account is named.
Channel figures come from OutlierKit's live channel analyses. The project-management example is illustrative, not a client engagement.
Sources
- Cleo Abram channel analysis: subscribers, average views and reach per upload
- Economics Explained channel analysis: subscribers, average views and reach per upload
- John Hammond channel analysis: the 2.3% contested-lane comparison
- Iman Gadzhi channel analysis: the 6.3% contested-lane comparison
- OutlierKit reach ratio benchmarks: views per subscriber medians across 7 niches

Related reading
Find the lane your brand can own
Map your category's outliers, follow the attention, and find the whitespace no competitor serves. Book a 30-minute walkthrough with the founder.
Book a Demo