How to Check YouTube Channel Health: The Complete 6-Step Guide (2026)
A YouTube channel health check is a structured review of your content performance, engagement, SEO, growth trajectory, and monetization — scored across 5 dimensions to give you a clear picture of what's working and what needs fixing.
Most creators guess at their channel's health based on feelings: “views seem down,” “growth feels slow,” “engagement looks okay.” But without a systematic YouTube channel health check, you cannot tell which dimension is dragging your channel down or which is quietly driving your success. This guide gives you a repeatable 6-step process to check your YouTube channel health using free tools, benchmark against competitors, and calculate a composite health score you can track every quarter. Whether you have 1,000 subscribers or 100,000, the framework works the same way.
TL;DR — The 6-Step YouTube Channel Health Check
- Step 1: Content Performance — check CTR, AVD, views per video, outlier ratio
- Step 2: Engagement Health — check likes ratio, comment rate, subscriber conversion, shares
- Step 3: SEO Strength — check search traffic %, title optimization, descriptions, end screens
- Step 4: Growth Velocity — check sub growth rate, view trends, upload consistency, traffic mix
- Step 5: Monetization — check RPM trend, revenue streams, demographics alignment
- Step 6: Health Score — score each dimension 1-10, calculate composite /50, identify weakest area
| Step | Health Dimension | Key Metric | Healthy Benchmark |
|---|---|---|---|
| Step 1 | Content Performance | CTR + AVD | CTR > 4%, AVD > 40% |
| Step 2 | Engagement Health | Likes ratio + comments | Likes > 4%, comments > 2/1K views |
| Step 3 | SEO Strength | Search traffic % | Search > 20% of total views |
| Step 4 | Growth Velocity | Sub growth rate | > 3% monthly growth |
| Step 5 | Monetization | RPM trend + streams | Rising RPM, 2+ revenue streams |
| Step 6 | Health Score | Composite score /50 | 35+ = healthy channel |
What Is a YouTube Channel Health Check?
A YouTube channel health check is a data-driven diagnostic that evaluates your channel across five measurable dimensions: content performance, engagement, SEO strength, growth velocity, and monetization readiness. Unlike a full YouTube channel audit (which dives deep into every element of your channel), a health check focuses on the vital signs — the metrics that tell you whether your channel is thriving, stable, or declining.
Think of it like a medical checkup versus a full diagnostic workup. The health check takes 45-60 minutes and gives you a composite score out of 50. If the score reveals a problem area, you can then run a deeper audit on that specific dimension using our YouTube channel audit tool.
Who is this guide for?
- • YouTube creators who want to check their channel health regularly (quarterly)
- • Anyone searching “check my YouTube channel health” or “YouTube channel health check online free”
- • Marketing agencies evaluating client channels or potential sponsorship partners
- • Channel buyers doing due diligence before acquiring a YouTube channel

OutlierKit's Channel Overview shows key health metrics at a glance — subscriber stats, view performance, and growth trends.
YouTube Channel Health Check Tool
Run a free YouTube channel health check with OutlierKit
Automated 5-dimension scoring, competitor benchmarks, content gap discovery, and prioritized recommendations — all in one tool.
The Health Check Process at a Glance
Six steps — check each dimension, score it, then calculate your composite health score.
Content Performance
Engagement Health
SEO Strength
Growth Velocity
Monetization
Health Score
Check each dimension → score 1-10 → calculate composite /50 → prioritize weakest area → repeat in 90 days
Before You Start: What You Need
To run a complete YouTube channel health check, you need access to your channel data and optionally a benchmarking tool for competitor context. Here is your setup checklist:
Required (Free)
- 1YouTube Studio — set your analytics date range to the last 90 days and have the Overview, Reach, Engagement, and Audience tabs ready.
- 2A spreadsheet or document — to record your scores and notes. You will compare these at your next quarterly health check.
Recommended (For Competitor Context)
- • OutlierKit's Channel Audit Tool — automated health scoring, competitor benchmarks, and content gap analysis
- • Social Blade — free historical subscriber and view tracking for competitor channels
- • UTubeKit — free title scorer, tag generator, and keyword research for the SEO dimension
The 6-Step YouTube Channel Health Check
Check Your Content Performance Metrics
Content performance is the foundation of channel health. A channel with great content but poor packaging will underperform, and a channel with great packaging but weak content will burn through audience trust. This step measures both sides: are people clicking (CTR) and are they staying (AVD)? These two metrics alone predict more about your channel's future than subscriber count ever will.
Click-through rate (CTR)
Open YouTube Studio > Analytics > Reach tab. Set the date range to the last 90 days. Your impressions CTR tells you how effective your titles and thumbnails are at earning clicks. Benchmark: 2-10% is the normal range, with 4-7% being healthy for most niches. Below 2% means your packaging needs serious work. Above 10% usually means YouTube is only showing your videos to a very targeted audience (low impressions). Compare CTR across your recent uploads to identify which title/thumbnail combinations work best.
Average view duration (AVD)
In YouTube Studio > Analytics > Engagement tab, check your average view duration as a percentage of total video length. Benchmark: 40-60% is healthy for long-form content. Below 30% signals that viewers are leaving too early — either your intro is too slow, the content does not deliver on the title's promise, or the pacing has dead zones. Check the retention curve for your last 10 videos to spot recurring drop-off patterns. A consistent dip at the 30-second mark means your hooks need work.
Views per video (last 90 days)
Calculate your average views per video over the last 90 days. This normalizes for upload frequency and gives you a baseline to track. If your average is declining over 3 consecutive months, your content strategy needs a reset. Compare this number to competitors of similar size using OutlierKit's competitor analysis — if rivals get 3x your views per video, they have found a format or topic cluster you have not.
Outlier ratio
What percentage of your videos significantly outperform your channel average? A healthy channel produces outliers (videos getting 3x+ normal views) at least 10-15% of the time. If none of your recent videos break out, your content may be too predictable or you are not experimenting enough with topics and formats. Use OutlierKit's Outlier Finder to identify which of your videos are true outliers and what they have in common.
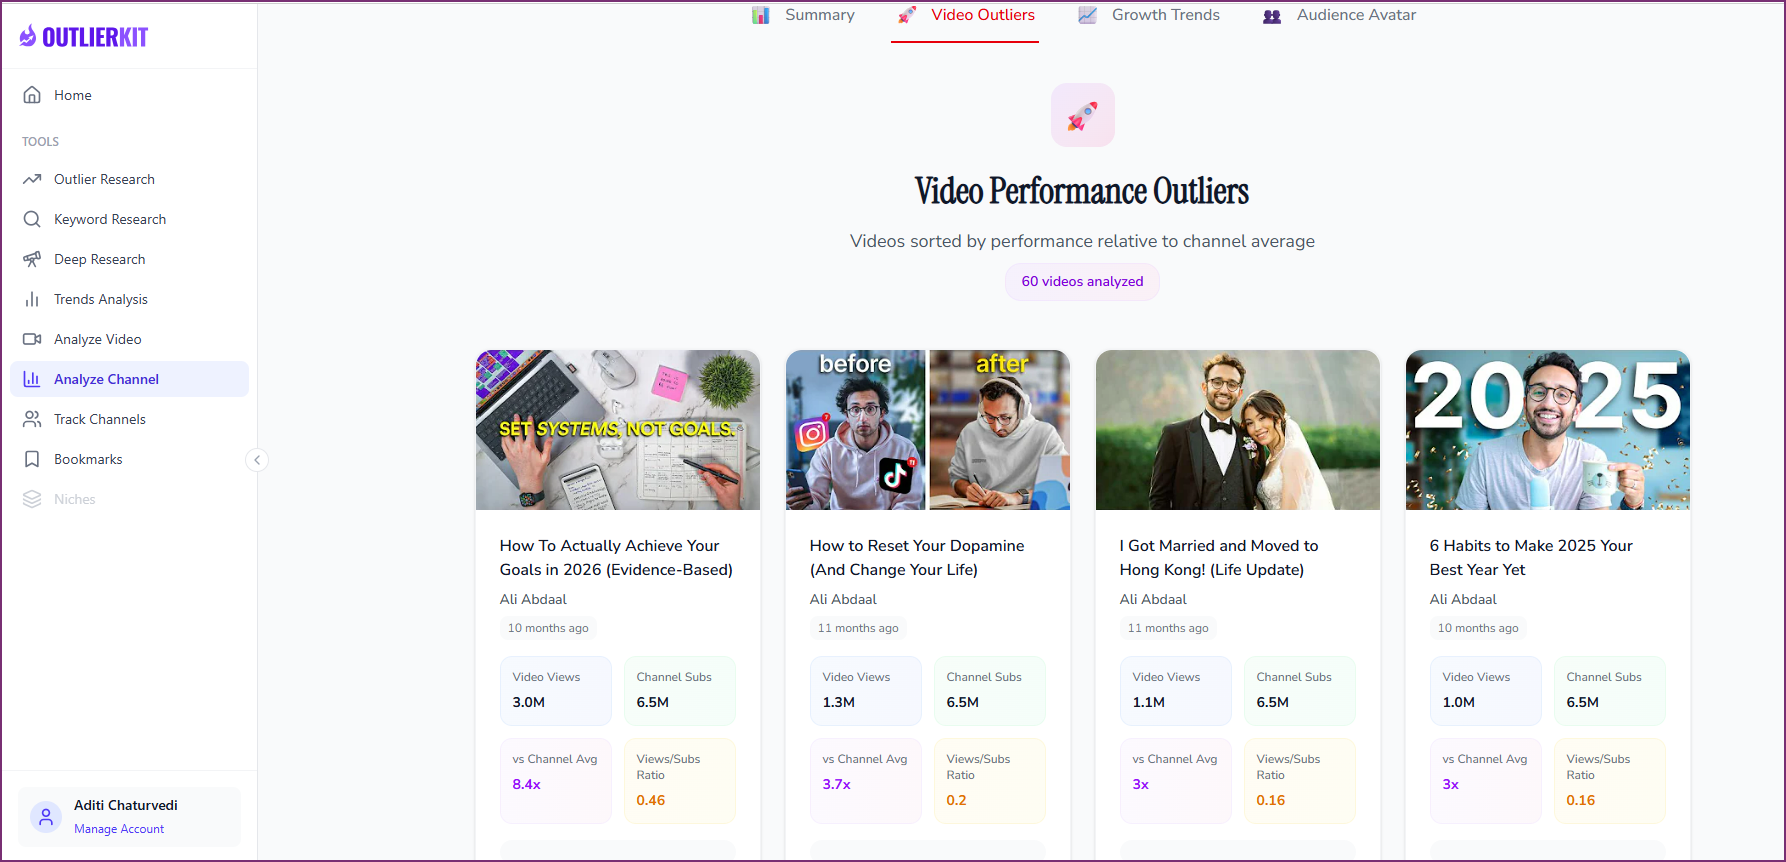
OutlierKit identifies which videos outperform your channel average — a key indicator of content performance health.
Quick Wins for Step 1
- Check your CTR for the last 90 days — if below 4%, thumbnail redesign is your highest-leverage fix
- Review retention curves for your last 5 videos and note the exact timestamp where viewers drop off
- Calculate your outlier ratio — if below 10%, you need to experiment more with topics and formats
Check Your Engagement Health
Engagement metrics reveal whether viewers passively consume your content or actively participate. A channel with 100,000 subscribers but weak engagement is worth less — to algorithms and sponsors — than a 10,000-subscriber channel with a highly engaged community. YouTube's algorithm uses engagement signals (likes, comments, shares) to decide whether to recommend your content to new viewers. Strong engagement also builds the kind of community that sustains a channel through algorithm shifts.
Likes-to-views ratio
Divide total likes by total views for your last 20 videos. Benchmark: 4-6% is healthy for most niches. Below 2% means your content is not resonating strongly enough — viewers watch but do not feel compelled to express approval. Above 8% suggests an unusually passionate audience, which is common in tight-knit niche communities. Track this ratio monthly because a declining trend is an early warning that content quality or audience-content fit is slipping.
Comment rate per 1,000 views
Calculate comments per 1,000 views for your recent uploads. Benchmark: 2-5 comments per 1,000 views is healthy. Below 1 per 1,000 suggests your content does not provoke discussion, questions, or emotional response. High-comment videos typically contain opinion-based content, tutorials where viewers ask follow-up questions, or content that creates a strong emotional reaction. Check whether you are responding to comments within 24 hours — YouTube counts your replies as additional engagement signals.
Subscriber conversion rate
In YouTube Studio's advanced analytics, check how many subscribers each video generates per 1,000 views. Benchmark: 1-3% is healthy. Videos that drive high subscriber conversion are your best gateway content — they attract people who want more. If your conversion rate is below 0.5%, your content may satisfy curiosity without building loyalty. Check whether your best-converting videos share a common format or topic — that pattern is your channel's core value proposition.
Share rate
Check how often your videos are shared to external platforms (visible in YouTube Studio under Reach > External sources). Share rate is one of the strongest positive signals for YouTube's recommendation engine because it indicates viewers found the content valuable enough to recommend to someone else. Low share rates often mean your content is useful but not memorable — it lacks the surprising statistic, strong opinion, or useful framework that motivates sharing.
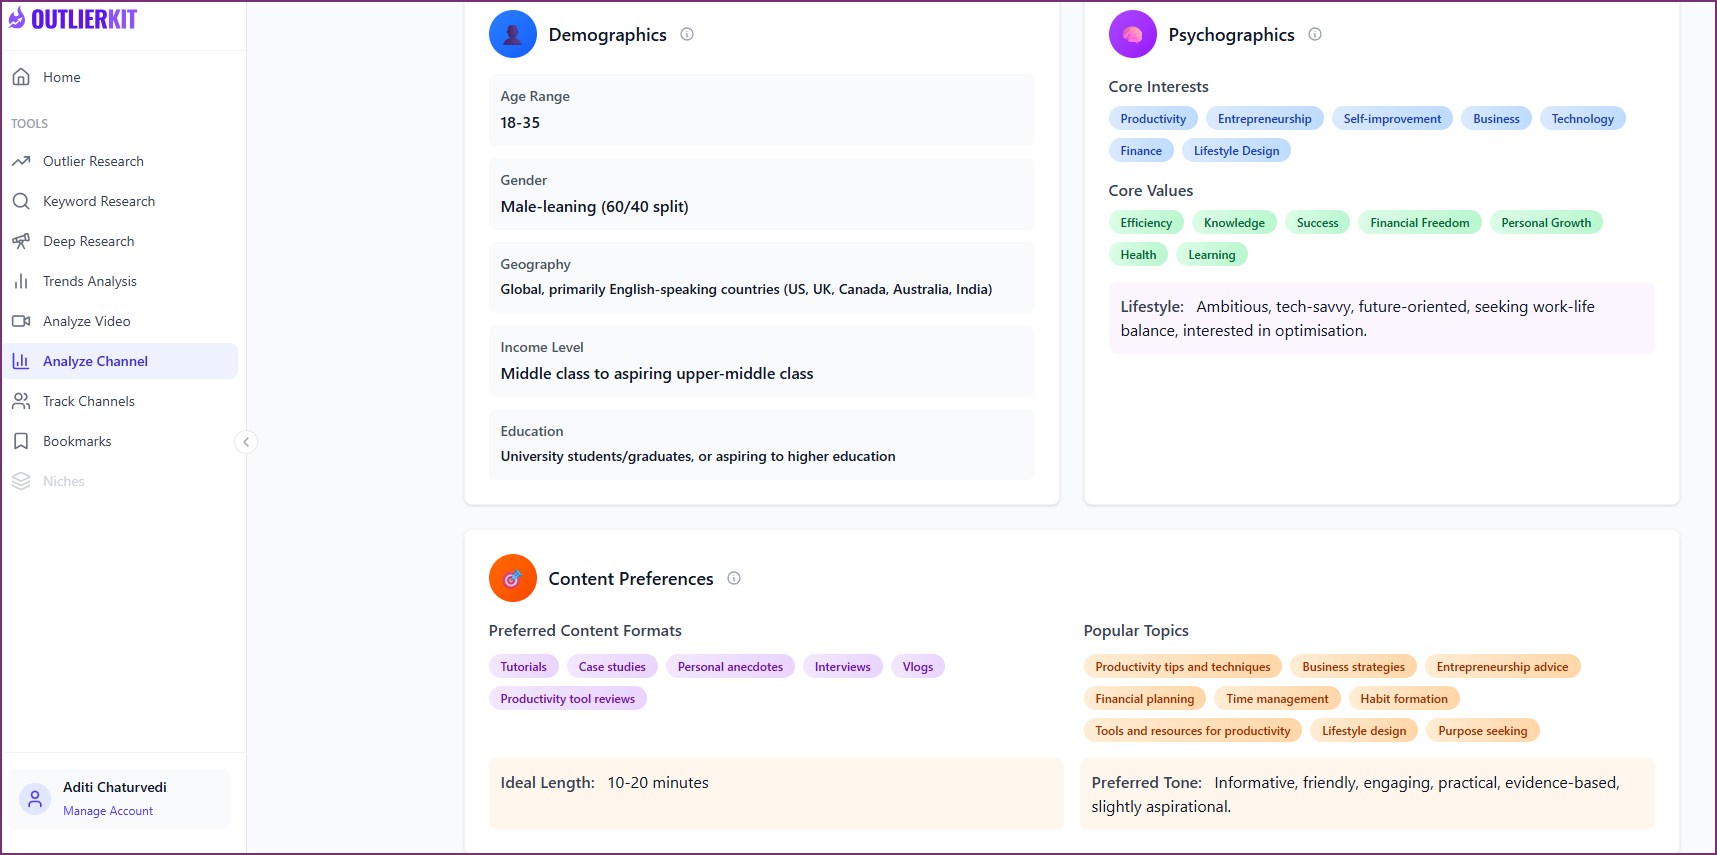
Audience analytics reveal who your viewers are and what content formats they prefer — essential for measuring engagement health.
Quick Wins for Step 2
- Respond to every unanswered comment on your last 10 videos — this boosts engagement signals immediately
- Add a specific question in your video's first 30 seconds to seed the comment section
- Check your subscriber conversion rate — identify your top 3 converting videos and create follow-ups
Check Your YouTube SEO Strength
SEO strength determines how much free, compounding traffic your channel generates from YouTube Search and Google. Search-driven views are among the most valuable because they represent active intent — someone typed a query and your video answered it. Unlike browse or suggested traffic, search traffic compounds over time. A well-optimized video can generate views from search for years after upload. This step checks whether your channel is capturing the search demand that already exists for your topics.
Search traffic percentage
In YouTube Studio > Analytics > Reach > Traffic source types, check what percentage of your total views come from YouTube Search. Benchmark: 15-30% is healthy. Below 10% means your videos are not optimized for search or you are not targeting keywords with search volume. Above 40% might mean your browse and suggested traffic are underperforming. A balanced traffic mix protects you from algorithm changes — if one source dips, the others sustain you.
Title keyword optimization
Review your last 20 video titles. Does your primary keyword appear in the first 60 characters? Titles that bury the keyword at the end or omit it entirely lose search traffic because YouTube weighs the beginning of the title more heavily. Use UTubeKit's free title scorer to evaluate your titles. The best titles balance keyword targeting with emotional pull — they tell the algorithm what the video is about and tell the viewer why they should care.
Description optimization
Check your first 2-3 description lines (the part visible in search results without clicking 'Show more'). Do they include your primary keyword naturally? A strong description is 200-500 words with the keyword in line 1, chapter timestamps, and relevant links. Many creators leave their descriptions blank or use a single sentence — this is leaving search traffic on the table.
End screen and card coverage
What percentage of your videos have end screens? Benchmark: 100% of your videos should have end screens pointing to your best related video and a subscribe button. Check your end screen click rate in YouTube Studio — if below 1%, your end screen design or video selection needs improvement. Missing end screens means lost subscribers and reduced session watch time on every single video.
OutlierKit's Keyword Research tool shows search volume and competition data — use it to audit your SEO strength.
Quick Wins for Step 3
- Add keywords to the first line of your top 20 videos' descriptions
- Install end screens on every video that is missing them — this takes 2 minutes per video
- Check your search traffic percentage — if below 15%, your SEO needs significant investment
Check Your Growth Velocity
Growth velocity measures whether your channel is accelerating, plateauing, or declining. This is the most important dimension for long-term channel health because it predicts your future trajectory. A channel can have decent metrics today but still be in decline if each upload performs slightly worse than the last. Conversely, a channel with modest numbers but steadily improving performance is on a healthy trajectory. This step zooms out from individual video performance to channel-level trends.
Monthly subscriber growth rate
Calculate your subscriber growth rate over the last 3 months. Formula: (new subscribers this month / total subscribers at start of month) x 100. Benchmark: 3-5% monthly growth is healthy for channels under 100K subscribers. 1-3% is sustainable for larger channels. Below 1% signals stagnation. If growth is declining month-over-month even while you maintain upload consistency, your content-audience fit may be weakening or competitors may be capturing your audience.
30-day vs 90-day view trend
Compare your average daily views over the last 30 days against the last 90 days. If the 30-day average is higher, your channel is trending upward. If it is lower, you are in a declining trend. Seasonal channels should compare the same month year-over-year instead. This comparison cuts through the noise of individual video performance and reveals whether your channel's baseline is rising, flat, or falling.
Upload consistency
Plot your actual upload dates over the last 3 months. How consistent is your schedule? YouTube rewards channels that train viewers to expect content at predictable intervals. If you planned to post weekly but averaged once every 12 days, that inconsistency hurts algorithmic momentum. Calculate your consistency score: (number of weeks you uploaded on schedule / total weeks) x 100. Aim for 80% or higher.
Traffic source diversification
Check your traffic source breakdown in YouTube Studio. A healthy channel draws no more than 40% of views from any single source (Browse, Search, Suggested, External). Heavy reliance on one source is risky — an algorithm change affecting that source could devastate your views overnight. If Browse accounts for 60%+ of your traffic, deliberately building search traffic through SEO and external traffic through cross-platform promotion is an insurance policy against algorithmic volatility.
Benchmark your growth velocity against competitors — see who is growing fastest and converting the most viewers.
Quick Wins for Step 4
- Calculate your subscriber growth rate for the last 3 months — is it accelerating or decelerating?
- Compare your 30-day vs 90-day average daily views to determine your current trend direction
- Check if any single traffic source exceeds 40% — if so, plan to diversify
Check Your Monetization Readiness
Monetization readiness measures how effectively your channel converts views into revenue and how sustainable that revenue is. Even if you are not yet monetized, this dimension matters because it tracks the signals sponsors and advertisers care about. A channel with strong monetization readiness attracts better brand deals, commands higher rates, and generates more predictable income. This step evaluates whether your revenue is growing, diversified, and aligned with your audience's demographics.
RPM trend
If monetized, track your Revenue Per Mille (RPM) over the last 6 months. Is it rising, flat, or declining? RPM naturally dips in January and July (post-holiday ad spend reduction) and peaks in November-December. Compare your trend against these seasonal patterns to distinguish between macro shifts and channel-specific problems. If your RPM is declining while your niche's CPM is stable, your audience composition may be shifting toward lower-CPM demographics or geographies.
Revenue stream count
Count your active revenue streams: AdSense, sponsorships, affiliate marketing, digital products, merchandise, memberships, Super Chats, etc. Benchmark: 2+ streams is the minimum for a healthy channel. Relying solely on AdSense means one demonetization decision or CPM shift can cut your income dramatically. The most resilient creators have 3-4 revenue streams where no single source accounts for more than 50% of total revenue.
Sponsorship potential
Even if you do not have sponsors yet, evaluate your channel's attractiveness to brands. Key signals: engaged niche audience (not generic entertainment), consistent upload schedule, professional presentation, and a clear brand message. Channels with 10,000+ subscribers and strong engagement metrics in a defined niche are attractive to sponsors. If brands are not reaching out, check whether your About section and channel page communicate your niche clearly enough for sponsor discovery.
Audience demographics alignment
In YouTube Studio > Audience, check your age, gender, and geography breakdown. Higher-CPM demographics (25-44, US/UK/CA/AU) command 2-5x the ad rates of lower-CPM demographics (13-17, developing markets). If your content targets a premium demographic but your actual audience skews younger or to lower-CPM regions, your packaging or distribution strategy has a mismatch that is costing you revenue even when views are strong.
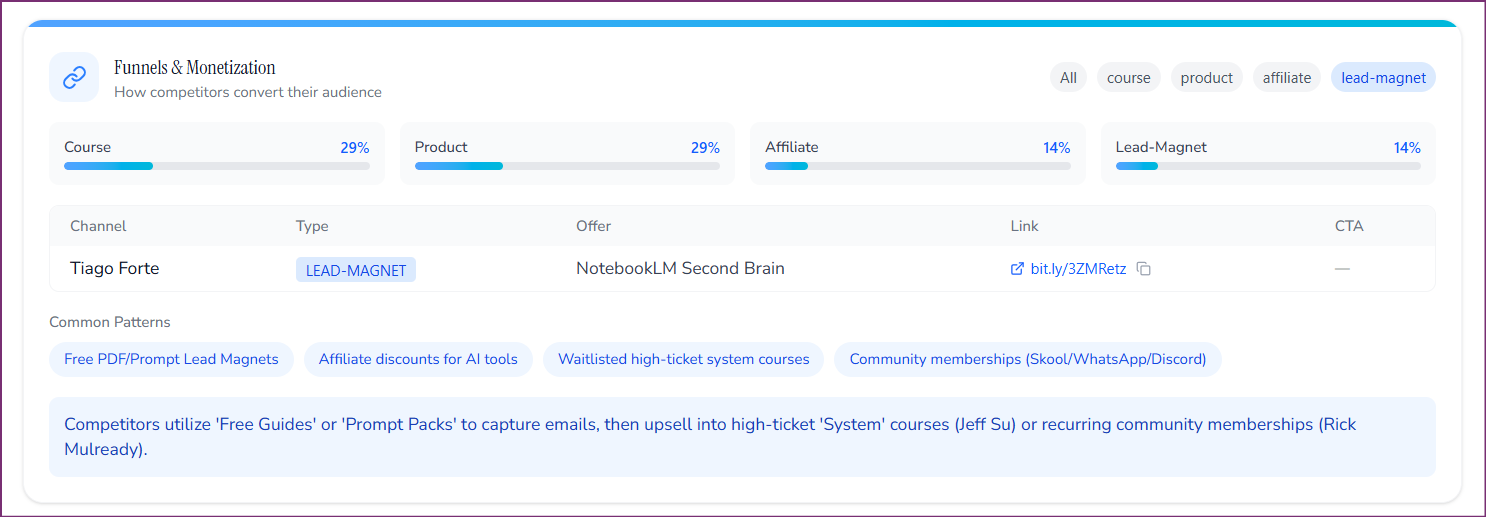
Analyze monetization funnels and revenue stream patterns to evaluate your channel's monetization readiness.
Quick Wins for Step 5
- Count your active revenue streams — if only 1 (AdSense), start exploring affiliate links or digital products
- Check your audience demographics — are they aligned with your target market?
- Add a business email and media kit link to your About section if you want sponsor inquiries
Calculate Your Channel Health Score
The final step pulls everything together into a single composite score that makes it easy to track progress across quarterly health checks. Instead of drowning in dozens of individual metrics, you score five dimensions from 1-10 and get a clear picture of where your channel stands and what to prioritize. This scoring framework, based on the OutlierKit Channel Health Score methodology, gives you a repeatable system for measuring improvement over time.
Score each dimension (1-10)
Using the benchmarks from steps 1-5, rate each dimension: Content Performance, Engagement Health, SEO Strength, Growth Velocity, and Monetization Readiness. Be honest — the score is only useful if it reflects reality. A 7-10 means the dimension is strong and competitive. A 4-6 means functional but with clear room for improvement. A 1-3 means this dimension is actively holding your channel back.
Calculate your composite score
Add your five dimension scores for a total out of 50. Score interpretation: 40-50 = Excellent channel health, you are outperforming most channels in your niche. 35-39 = Healthy, with minor areas to optimize. 25-34 = Functional but 1-2 dimensions are dragging you down. Below 25 = At least two dimensions need urgent attention before focusing on content creation.
Identify your weakest dimension
Your lowest-scoring dimension is where improvement will have the biggest impact. A channel scoring 8/8/8/3/8 (composite: 35) would jump to 40+ by fixing the weak dimension alone. Focus 80% of your optimization effort on your weakest area for the next 90 days. Do not try to improve all five dimensions simultaneously — that dilutes your effort and makes it impossible to measure what worked.
Set your next health check date
Schedule your next YouTube channel health check for 90 days from today. Document your current scores and the specific actions you plan to take. At your next check, compare the new scores against this baseline. The quarterly cadence ensures you catch problems early and maintain a culture of continuous improvement. Use OutlierKit's channel audit tool to automate the data collection and benchmarking portions of future health checks.
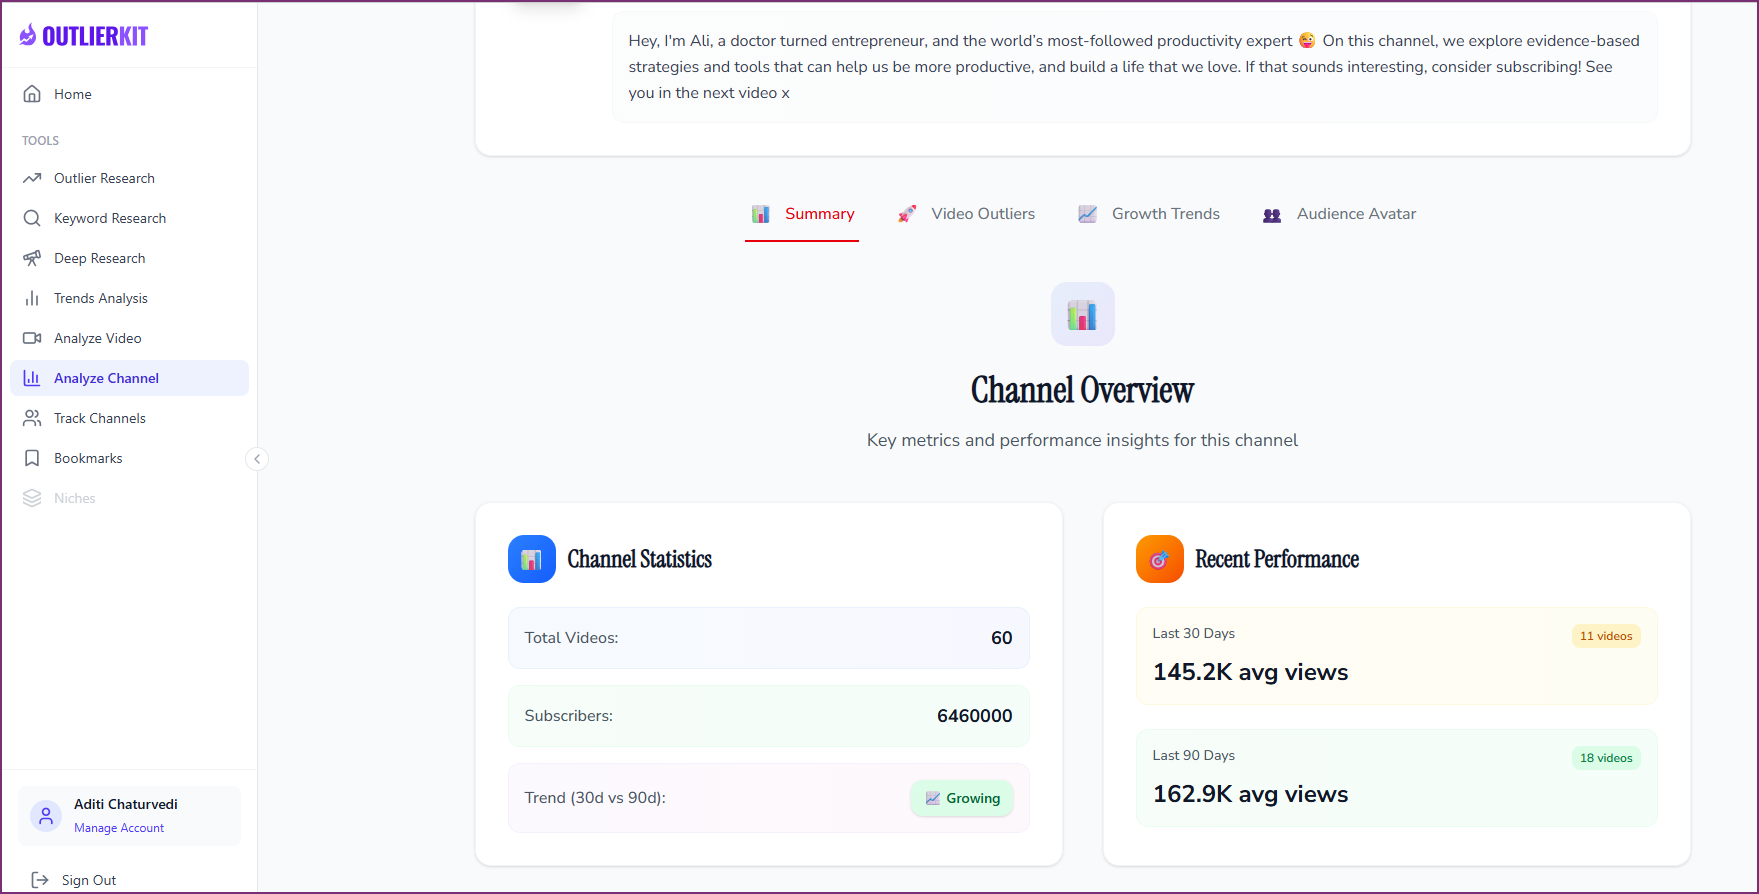
Your Channel Overview dashboard provides the metrics you need to score each health dimension and calculate your composite score.
Quick Wins for Step 6
- Score all 5 dimensions right now and write down your composite score
- Identify your single weakest dimension — that is your focus for the next 90 days
- Set a calendar reminder for your next health check in 90 days
- Share your scores with any collaborators who can help address weak areas
The YouTube Channel Health Score Framework
Score each dimension from 1-10 using the benchmarks below. Add all five scores for your composite channel health score out of 50. This framework is based on OutlierKit's Channel Health Score methodology.
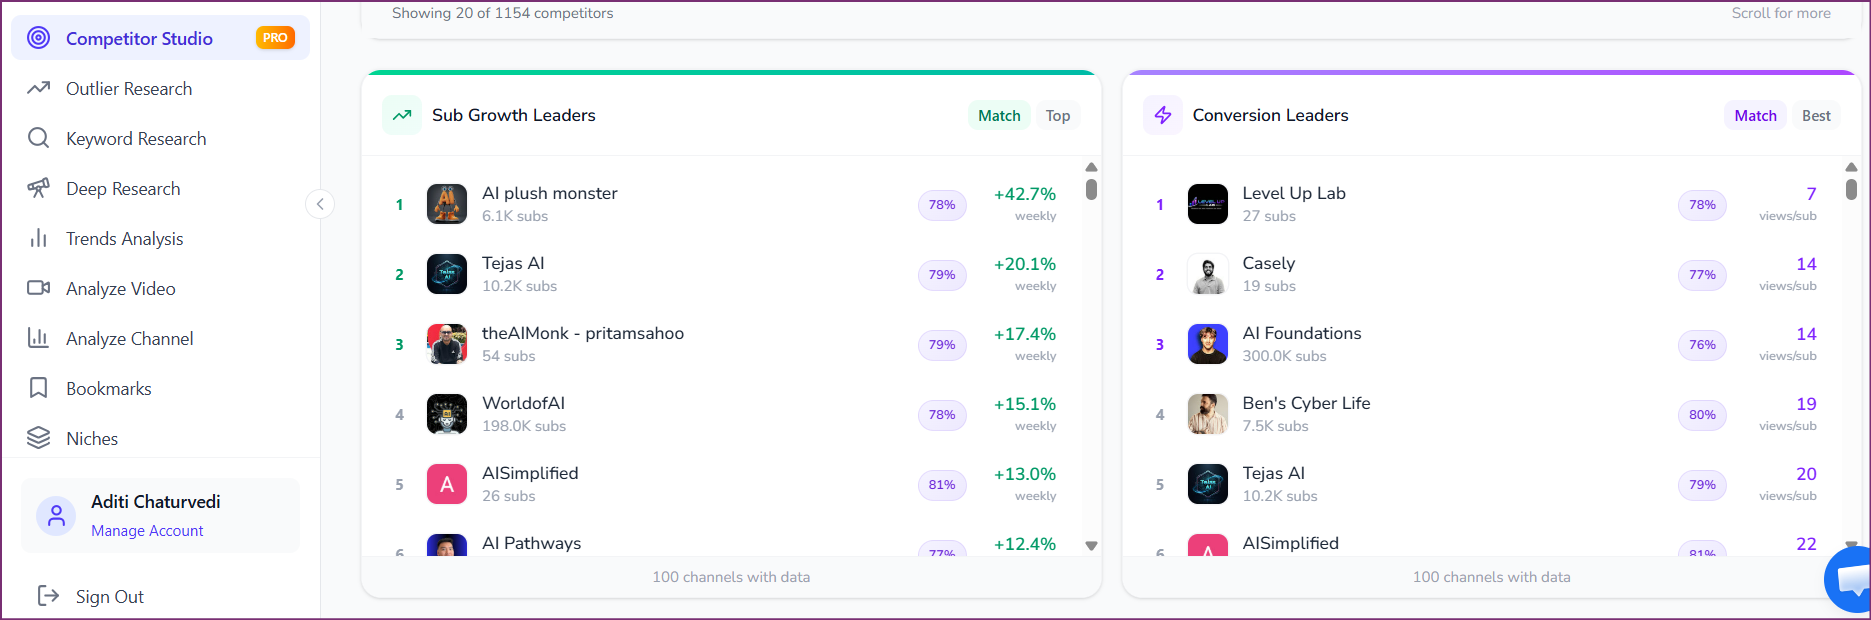
OutlierKit's advanced competitor research automates benchmarking — compare your health metrics against any channel in your niche.
Content Performance
Key Metrics
- •Click-through rate (CTR) vs. niche average
- •Average view duration (AVD) as % of video length
- •Outlier ratio — % of videos hitting 3x+ channel average
Good (7-10)
CTR > 6%, AVD > 45%, outlier ratio > 15%
Average (4-6)
CTR 3-6%, AVD 30-45%, outlier ratio 5-15%
Poor (1-3)
CTR < 3%, AVD < 30%, outlier ratio < 5%
Engagement Health
Key Metrics
- •Likes-to-views ratio
- •Comment rate per 1,000 views
- •Subscriber conversion rate per video
Good (7-10)
Likes > 5%, comments > 3/1K views, sub conversion > 2%
Average (4-6)
Likes 2-5%, comments 1-3/1K views, sub conversion 0.5-2%
Poor (1-3)
Likes < 2%, comments < 1/1K views, sub conversion < 0.5%
SEO Strength
Key Metrics
- •% of videos with optimized titles
- •Search traffic as % of total views
- •Number of page 1 keyword rankings
Good (7-10)
> 80% optimized titles, search > 25%, 10+ rankings
Average (4-6)
50-80% optimized, search 10-25%, 3-10 rankings
Poor (1-3)
< 50% optimized, search < 10%, < 3 rankings
Growth Velocity
Key Metrics
- •Monthly subscriber growth rate
- •30-day vs. 90-day views trend
- •Upload consistency score
Good (7-10)
Sub growth > 5%/mo, views trending up, > 80% consistency
Average (4-6)
Sub growth 1-5%/mo, views flat, 50-80% consistency
Poor (1-3)
Sub growth < 1%/mo, views declining, < 50% consistency
Monetization Readiness
Key Metrics
- •RPM trend (rising, flat, or falling)
- •Revenue stream diversification
- •Audience demographic alignment
Good (7-10)
RPM rising, 3+ revenue streams, premium demographics
Average (4-6)
RPM flat, 2 revenue streams, mixed demographics
Poor (1-3)
RPM falling, ads-only, misaligned demographics
How to interpret your score
- 40-50: Excellent — your channel outperforms most competitors. Focus on maintaining momentum.
- 35-39: Healthy — solid fundamentals with minor areas to optimize.
- 25-34: Functional — 1-2 dimensions are dragging you down. Focus on your weakest area.
- Below 25: Urgent — at least two dimensions need immediate attention before investing more in content production.
Best YouTube Channel Health Check Tools (Free & Paid)
You can check your YouTube channel health online free with YouTube Studio alone, but these tools make the process faster and more comprehensive. For a full comparison of audit tools, see our Best YouTube Channel Audit Tools guide.
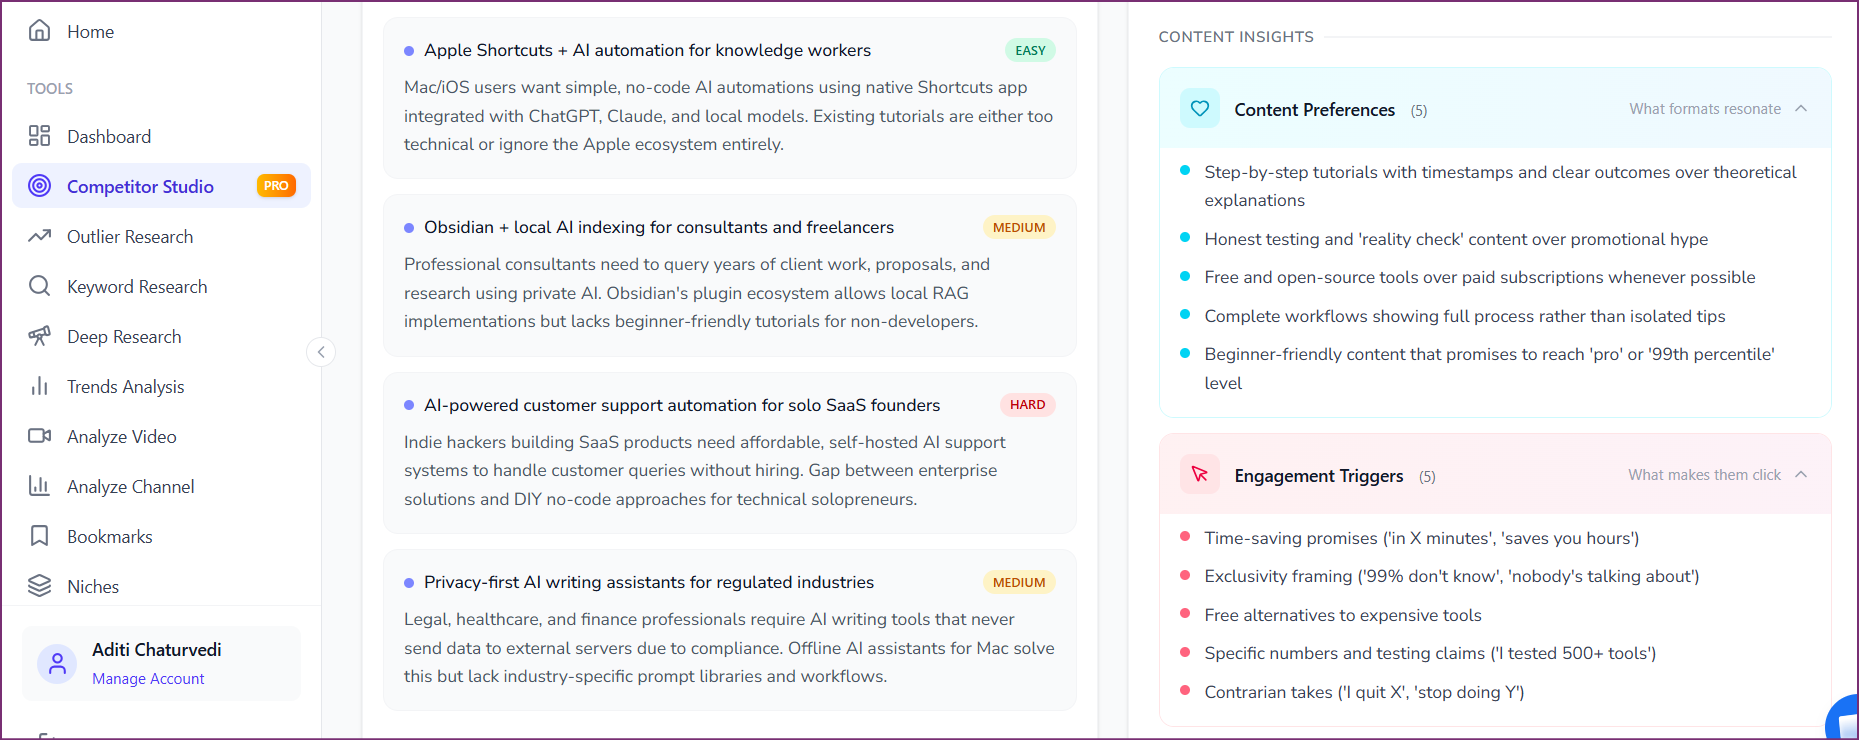
Advanced health check tools reveal content insights, engagement triggers, and audience preferences that basic analytics miss.
YouTube Studio
FreeWhat it does: Your own channel's analytics — CTR, AVD, traffic sources, audience demographics, and revenue data.
Best for: The definitive source for your first-party data. Every health check starts here.
Limitation: Cannot benchmark against competitors or analyze other channels.
OutlierKit
Free TrialWhat it does: Comprehensive channel audit with 5-dimension health scoring, competitor benchmarking, content gap analysis, and outlier detection.
Best for: The most complete YouTube channel health check tool — automates scoring and provides prioritized recommendations.
Limitation: Free trial available; full features require a subscription.
Social Blade
FreeWhat it does: Free historical subscriber and view tracking for any public YouTube channel.
Best for: Quick competitor benchmarking and historical growth trend analysis.
Limitation: No content-level analysis, no SEO scoring, no health framework.
UTubeKit
FreeWhat it does: Free AI-powered SEO tools — title scorer, tag generator, description writer, keyword research.
Best for: Evaluating and optimizing your video-level SEO as part of the SEO strength dimension.
Limitation: Focuses on individual video optimization, not holistic channel health.
Common YouTube Channel Health Check Mistakes
Using subscriber count as the primary health indicator
Why it's a problem: Subscribers are a vanity metric. A channel with 100K subscribers and 2% engagement is less healthy than a 10K channel with 8% engagement. Subscribers reflect past performance; engagement and growth velocity reflect current health.
Do this instead: Focus on CTR, AVD, engagement ratio, and subscriber growth rate as your primary health indicators.
Checking health once and never again
Why it's a problem: YouTube's algorithm changes, audience preferences evolve, and competitors adjust strategies. A one-time health check has a 90-day shelf life before the data becomes stale.
Do this instead: Run a health check every 90 days. Document your scores so each check builds on the last.
Looking only at the last 30 days of data
Why it's a problem: A 30-day snapshot can be skewed by a single viral video, seasonal trends, or algorithm fluctuations. Decisions based on short-term data lead to reactive strategy changes.
Do this instead: Compare metrics across 30-day, 90-day, and 12-month windows. Look for trendlines, not snapshots.
Ignoring competitor benchmarks
Why it's a problem: Without context, you cannot tell if your 4% CTR is strong or weak. Your niche's average might be 7%, making your number a problem — or 2%, making it a strength.
Do this instead: Use OutlierKit to benchmark against 3-5 comparable channels every quarter.
Treating Shorts and long-form as one channel
Why it's a problem: Shorts and long-form serve different purposes and are measured by different benchmarks. A Shorts AVD of 50% is weak; a long-form AVD of 50% is excellent. Mixing them produces misleading health scores.
Do this instead: Run separate health checks for your Shorts and long-form content.
Fixing everything at once instead of prioritizing
Why it's a problem: Trying to improve all 5 dimensions simultaneously dilutes effort and makes it impossible to measure what worked.
Do this instead: Focus 80% of effort on your weakest dimension for 90 days. Change one variable at a time.
Frequently Asked Questions
Basics & Getting Started
How do I check my YouTube channel health for free?
You can run a YouTube channel health check for free using YouTube Studio Analytics (every YouTube account includes this), Social Blade (free historical stats for any channel), and UTubeKit (free SEO tools for title scoring, tag generation, and keyword research). For a more comprehensive health check with competitor benchmarking, content gap analysis, and a scored health report, OutlierKit offers a free trial of its channel audit tool.
What is a YouTube channel health check?
A YouTube channel health check is a systematic evaluation of your channel across five key dimensions: content performance (CTR, AVD), engagement (likes, comments, shares), SEO strength (search traffic, keyword optimization), growth velocity (subscriber growth rate, view trends), and monetization readiness (RPM, revenue diversification). It produces a composite score out of 50 that tells you exactly where your channel stands and what to improve first.
How often should I run a YouTube channel health check?
Run a full channel health check every 90 days (quarterly). This cadence gives you enough time to implement changes and observe their impact before re-evaluating. Also run a focused health check whenever growth stalls for 4+ consecutive weeks, after a significant YouTube algorithm update, or before pivoting your content strategy.
What is a good YouTube channel health score?
Using the 50-point scoring framework (5 dimensions scored 1-10 each), a score above 35 indicates a healthy channel with strong fundamentals across most dimensions. A score of 25-34 means your channel is functional but has clear weaknesses. Below 25 signals that at least two dimensions need urgent attention before you invest more time in content creation.
Tools & Advanced
What is the best YouTube channel health check tool?
For a free basic check, YouTube Studio combined with Social Blade covers the essentials. For a comprehensive health check with automated scoring, competitor benchmarking, and prioritized recommendations, OutlierKit is the most complete tool available — it evaluates all 5 health dimensions and generates an actionable report. VidIQ and TubeBuddy also offer channel health features but focus more on individual video optimization.
Can I check another channel's health online?
Yes. While YouTube Studio only shows your own data, tools like OutlierKit, Social Blade, and VidIQ can analyze any public YouTube channel. This is useful for competitor benchmarking, evaluating channels for acquisition, or studying how top creators in your niche perform. OutlierKit's channel audit tool lets you enter any channel URL and get a full health analysis.
What metrics matter most in a YouTube channel health check?
The two most diagnostic metrics are Click-Through Rate (CTR) and Average View Duration (AVD). CTR measures whether your packaging earns clicks; AVD measures whether your content keeps viewers watching. Together, they determine how aggressively YouTube promotes your content. After CTR and AVD, subscriber growth rate, engagement ratio, and search traffic percentage are the most important health indicators.
How long does a YouTube channel health check take?
A manual health check following this 6-step guide takes 45-60 minutes using YouTube Studio. Using a tool like OutlierKit, you can complete a comprehensive health check in under 10 minutes because it automates data collection, benchmarking, and scoring. Subsequent quarterly checks are faster than the first because you already have a baseline to compare against.
Related Guides & Resources

Also See
Ready to grow your YouTube channel?
OutlierKit helps you find winning content strategies with competitor analysis and keyword research.
Try OutlierKit Free